Trained to Deny: How LLMs Reject Capabilities They Demonstrably Have
A Case Study in AI Epistemic Distortion

Recently I learned of a cool Python package calledpandas_profilingthat serves as an extension of the pandas.DataFrame.describe() function in the pandas module. The package serves as a nice way to automate a lot of the common statistics generated when looking at data, such as the following:
Essentials: type, unique values, missing values
Quantile statistics like minimum value, Q1, median, Q3, maximum, range, interquartile range
Descriptive statistics like mean, mode, standard deviation, sum, median absolute deviation, coefficient of variation, kurtosis, skewness
Most frequent values
Histogram
Correlations highlighting of highly correlated variables, Spearman, Pearson and Kendall matrices
Missing values matrix, count, heatmap and dendrogram of missing values
This article will serve as an introduction to the package, and show the ease of use to implement it in Python.
To install the package, open an Anaconda prompt terminal and type:
pip install pandas_profiling
If you’re installing from a Jupyter notebook, you can instead type:
import sys
!{sys.executable} -m pip install pandas_profiling
Implementing thepandas_profilingmethod is as simple as adding one extra function to the end of a pandas DataFrame. To create and output the report, add.profile_report()after the name of the DataFrame and execute the function, which will then output an overview display similar to the screenshot below. For this example, I’ll be using data from the 2019 Economic Freedom of the World Index.
import pandas as pd
import pandas profiling

pd.read_excel("https://raw.githubusercontent.com/casey-barr/misc-data/master/economic_data/efw-2019-master-index-data-for-researchers.csv").profile_report()
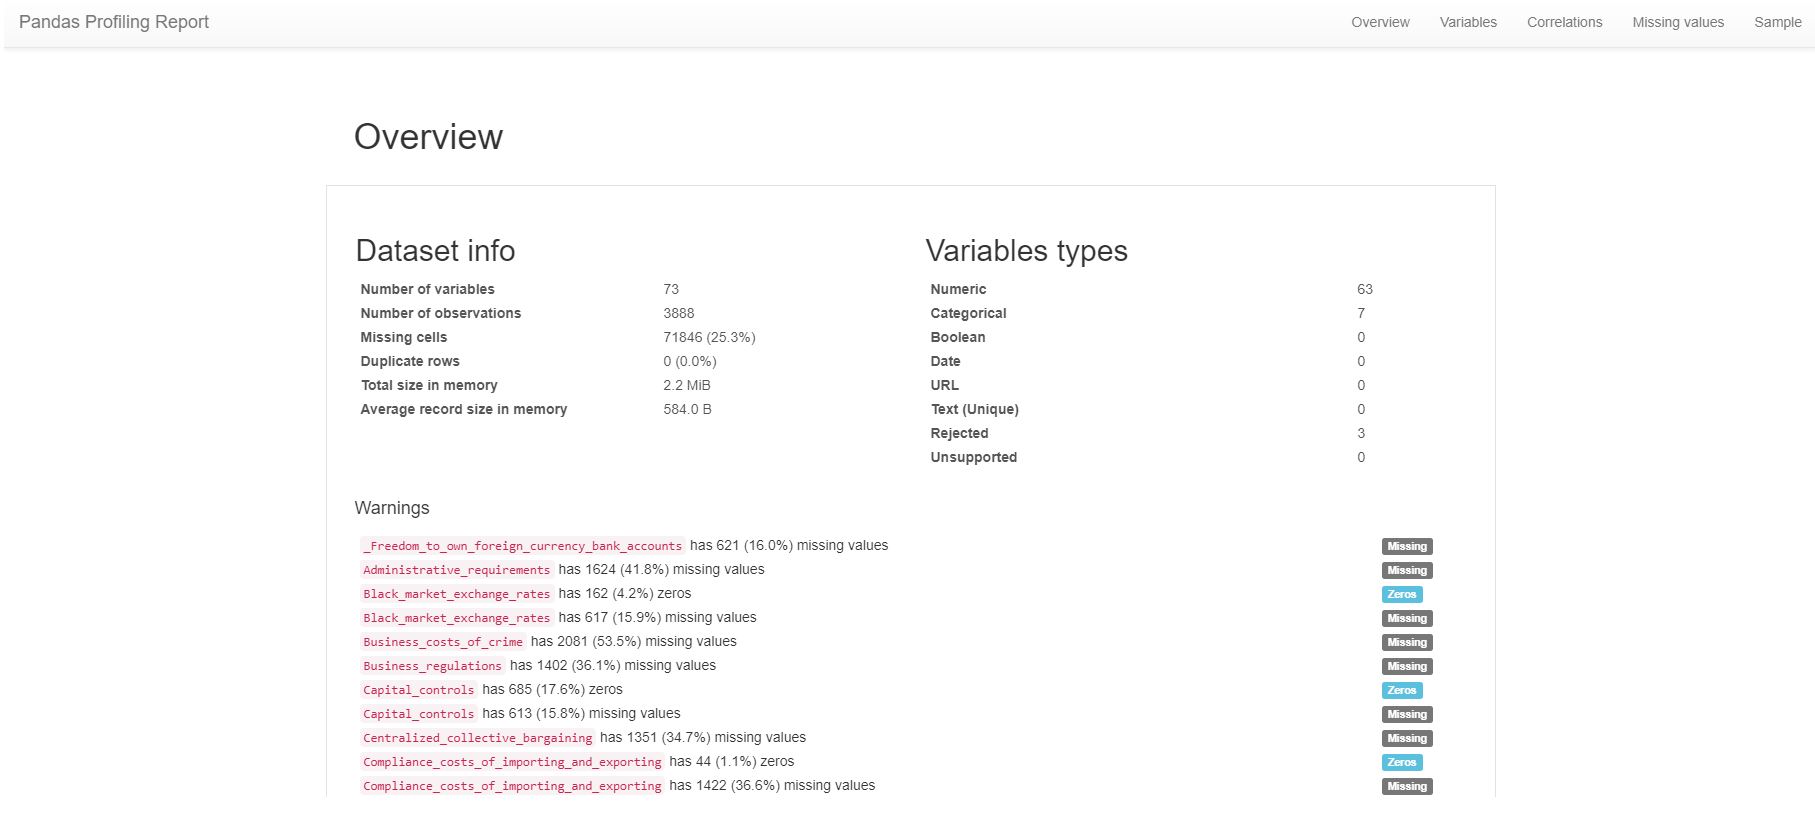
Below, you’ll also find a gif that highlights some of the other statistics and views that the profile_report() function generates.
 |
|---|
| Photo Credit: Peter Nistrup |
The pandas_profiling method generates a lot of interesting statistics regarding your dataset of focus, and does so in an efficient and automated way. I’ve since added it to my list of tools when analyzing data in Python, as it saves a lot of time when examining a large dataset that has a lot of cardinality.
Link to thepandas_profilingGitHub page.
A Case Study in AI Epistemic Distortion
Tchebycheff Approach
not financial advice, just a crypto degen thinking out loud
Thoughts I’ve had after reading the news about Apple’s new policies that support “Expanded Protections for Children”.
Using a Convolutional Neural Net to Swish the Kannada MNIST Challenge
Using Anaconda Behind a Firewall or Proxy
Recently I learned of a cool Python package calledpandas_profilingthat serves as an extension of the pandas.DataFrame.describe() function in the pandas modul...
This post is simply a collection of some of my favorite webcomics that my synthetic intelligence, nightfall, created during the last week and a half from Se...
A notebook detailing how to work through the Open AI taxi reinforcement learning problem written in Python 3. Source for environment documentation. import g...